
We are quite familiar with data from across the country which shows that people are driving less, taking public transit more and choosing to live in places which allow them to walk and bike to work. Studies are showing that these changes are likely to persist – with fewer Americans opting for a car-dependent lifestyle each year. These changes are good for the economy, for the environment and for public health.
Now, let’s see if Wisconsin is an exception to these changes, or whether it is in-line with national demographic trends through some data analysis. In order for us to negate external influences as much as possible, let’s look over a wide range of transportation and lifestyle trends which, when added up should give us a basic understanding of how people are choosing to travel.
Driving
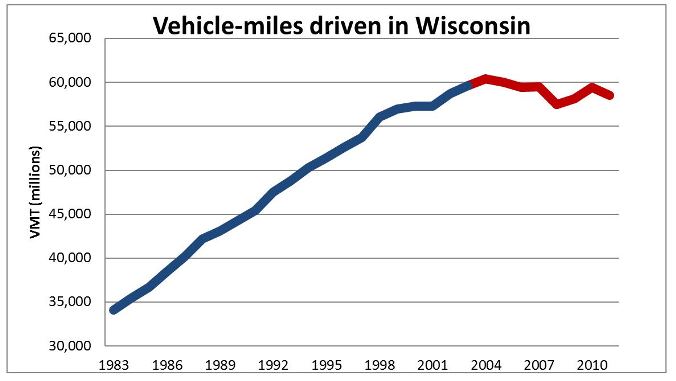
First, let’s look at total vehicle miles driven. National data shows that Americans have been driving less each year for almost a decade now, defying the trend of continuous increases since the construction of the interstate system in the 60’s. Data from the Wisconsin Department of Transportation shows that VMT in the state hit a peak in 2004, and has since flattened out. The average Wisconsinite drove 500 fewer miles in 2011 than in 2004.
Transit
Transit trends from across the nation show that there has been a steady upward growth in miles traveled using public transit, with 2011 recording highest ever ridership numbers. Does this hold true for Wisconsin? For this, let’s look at data from the National Transit Database, which is a self-reporting tool that contains ridership numbers for individual transit agencies in the US. The resulting graph looks like this:
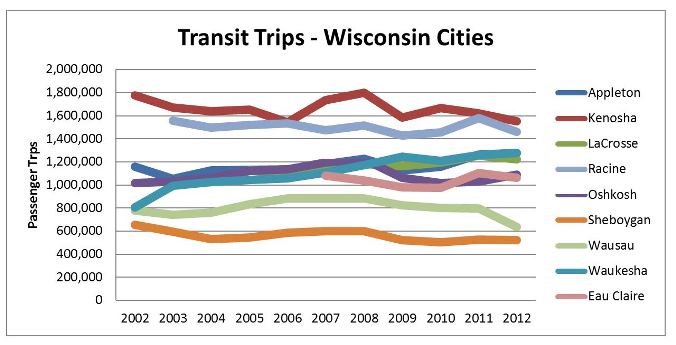
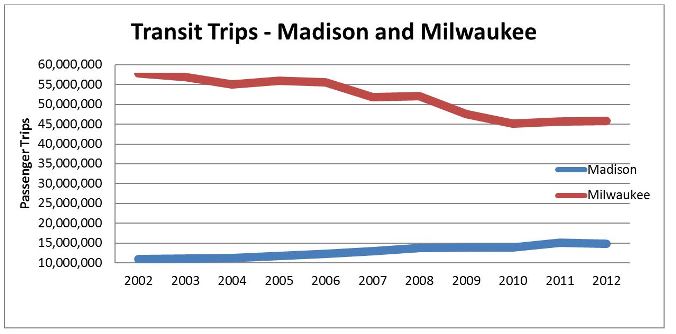
We see that transit ridership has remained fairly steady with the exception of Milwaukee and Madison – which have seen significant falls and growth respectively. As these two cities have ridership levels that are orders of magnitude greater than the rest of the state, they will be represented in a separate graphic. Milwaukee has the largest transit system in the state and has also seen the largest decline in terms of passenger trips. Significant, regular and persistent budget cuts have forced the system to cut many of its routes, leading to several thousand people being stranded with no access to jobs, school and medical appointments – which in turn leads to lower ridership numbers. On the other hand, Madison, which has invested in its transit system, has seen record ridership increases. Removing these two cities reveals that there has been a slight overall growth in transit ridership amongst all other transit systems in the state. What makes these visuals remarkable is that the state budget has severely cut transit funding forcing several operators to reduce the frequency of routes and in many cases do-away with routes altogether. These cuts will not even be partially restored until 2014, but transit ridership has remained steady, and in most cities has inched upwards over the last few years. This is in stark contrast to miles driven – where the state has been pouring in money for new highway expansion, and still seen people drive less each year.
Driver’s Licenses
Next, let’s look at driving license trends. National data shows that young people are delaying applying for a license and fewer young people overall are opting to even get one. Let’s look at the change in how many young people held drivers licenses in the last two national censuses in Wisconsin. Between 2000 and 2010, the total number of young people (16-34 year olds) in Wisconsin increased by two percent. In 2000, 81% of all people in the age group held a valid driver’s license. In 2010, that number decreased to 79% – a decrease of over two percent.
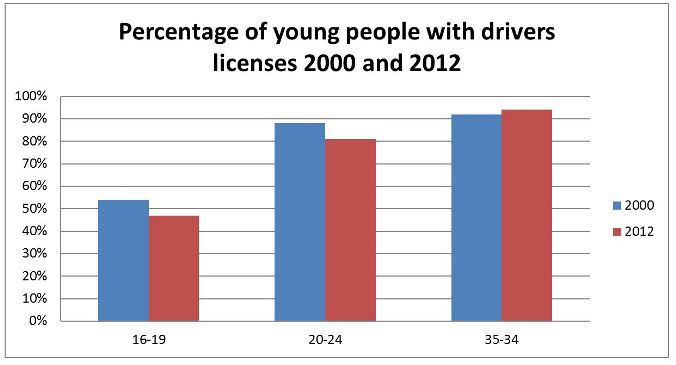
The decreases are even steeper if we slice the data into smaller age-groups. 16-19 year olds saw a 7% decrease in those holding driver’s licenses, while 20-24 year olds reduced their driver’s license holdings by 6%. Those in the 25-34 year old age group saw a one-percent increase. Overall, there was a decrease in the number of young people applying for driving licenses even though the total number of people in this age group increased.
Biking
Finally, let us look at bicycle ridership numbers. Although this data is hard to come by, cities which have invested in bicycling infrastructure are seeing substantial ridership improvement. For example, Madison has had an 88% increase in bicycle commuters over the last eight years, since the city released a plan to achieve a platinum rating for biking. Sheboygan County reported a 43% increase in daily non-recreational biking trips in just one year since the creation of a federally funded pilot program which aimed to connect the county’s bike and pedestrian network with schools, businesses and other destinations. Milwaukee County has seen bicycle use up 107% over the last ten years. The 2010 American Community Survey showed that .75% of all Wisconsin commuters use bicycles to get to work, which is 50% greater than the national average.
These statistics provide us with a snapshot of travel trends in the state. More comprehensive data collection and surveys may be able to provide us with a more complete picture, but the trends seen in Wisconsin seem to be well aligned with changing transportation demographics in the rest of the country. Planners, engineers and lawmakers must incorporate this information into their designs and decisions – to create transportation choices that are sustainable environmentally and fiscally. We can no longer continue to waste money building large highways hoping to solve our congestion problems.
–by Ash Anandanarayanan, Transportation Policy Analyst.