WisDOT’s Purpose and Need Document for the I 43 N-S corridor projects an increase of traffic on freeway segments (2010-2040) that varies between 32% and 39% based on population projections and an average annual traffic growth rate of 0.93%.
This conclusion is not supported by recent data and should be corrected to reflect reality.
The problem with the WisDOT analysis is twofold:
- It greatly overestimates the projected population growth by 2035.
- It compounds this error by using an unrealistic rate of 0.93% increase of per capita vehicle miles traveled (vmt).
First, the population projection is based on old data (2006) and should be updated with readily available newer data (2013) published by the Wisconsin Department of Administration.
The old data used in the WisDOT analysis (Land Use Plan for Southeastern Wisconsin (tables 28, 30, 31 and 35)) is 8 years old and should be replaced by the more recent and far more accurate data contained in the Wisconsin Department of Administration (Wisconsin’s Future Population, Projections for the State, Its Counties and Municipalities, 2010 – 2040 December 2013.) The more recent DOA analysis and projections have real data for 2010 (instead of the projected 2010 population in the 2006 report) and revised estimates for 2030 and 2040 population that are far below the population projected in the WisDOT document for 2035.
According to the old data used by WisDOT, Ozaukee County is projected to have a population that will have grown by 22.8% by 2035 with a 2000 baseline. The more recent DOA projection is that the population will have grown by 13.8% by 2030 over 2000 and will fall to 12.1% by 2040.
This analysis is critical to the justification of this project, if the population is overestimated, the projected traffic increase will also be overestimated.
Second, WisDOT continues to make unrealistic projections of per capita traffic growth, using 0.93% as an average annual rate of increase. However, from 2002 until 2012, vmt has fallen in Ozaukee County at an average annual rate of 0.33% yet WisDOT mysteriously projects that the trend will take a radical reversal in suddenly increase at a rate 3 times faster than it has been decreasing for the past decade.
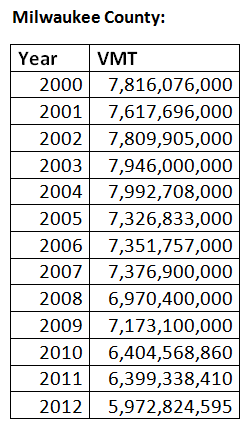
travel/counts/vmt.htm)
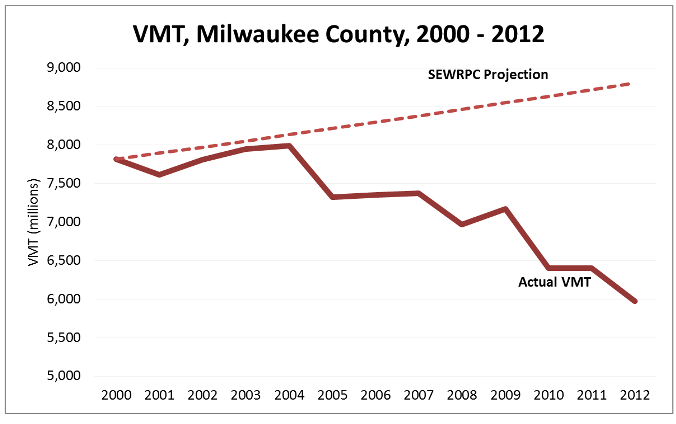
SEWRPC Projected VMT by 2012: 8,807,350,074
Actual VMT, 2012: 5,972,824,595
Discrepancy: 47% over-projection
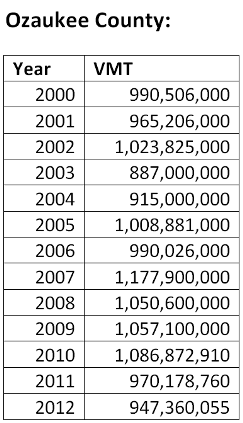
travel/counts/vmt.htm)
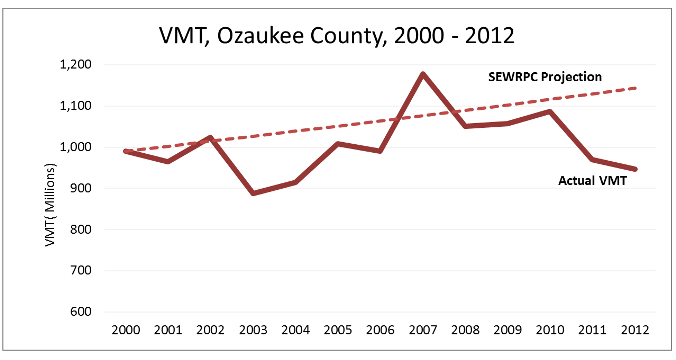
SEWRPC Projected VMT by 2012: 1,142,939,549
Actual VMT, 2012: 947,360,055
Discrepancy: 20.64% over-projection
There are two additional important factors that need to be considered in making projections:
- Younger residents have a definite change in their attitudes towards driving compared to previous generations.
- Wisconsin’s population is one that is aging. While the Department of Administration population projections show that by 2040 the state will experience a growth of approximately 800,000, nearly all (over 750,000) of that growth will occur in the over 65 population with a decrease in the 18-65 age group. Over the past ten years the actual rate of growth for per capita vmt has been decreasing.
Consider that in studies compiled by the Sightline Institute, there are very different driving habits amongst different age groups. Consider the chart:
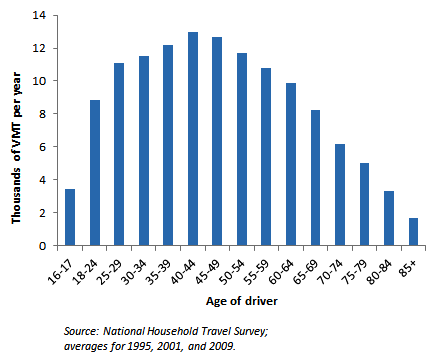
This chart shows clearly that driving peaks in drivers around the age of 40 and falls steadily during aging. Given that any increase in Wisconsin’s population is in the over 65 age group, it is impossible to reconcile how WisDOT can assume any increase in vmt – especially in light of the fact that they have already been shown to overestimate the likely rate of population growth in the target area.
WisDOT should recalculate its vmt estimates or demonstrate how they arrived at those conclusions.
-Steve Hiniker, Executive Director
