
WisDOT ignores projections that show driving flat lining or declining into the future.
Data from across the nation and in Wisconsin shows that the rate of driving has decreased or stagnated over the last decade.
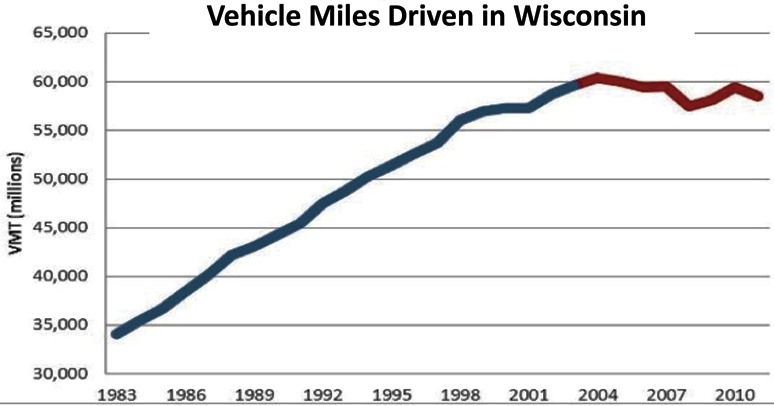
In Wisconsin, vehicle miles traveled have fallen consistently since peaking in 2007 – keeping in line with national trends. [1] Young people are leading this drop, with “millennials” choosing to acquire licenses at a rate far lower than preceding generations. [2]
 In addition, there is a nationwide surge in public transit and commuter rail usage [3]. Biking is up – with many states reporting increased bicycle share over the last five years [4]. There is a renewed interest in living in compact, mixed-use localities where owning a car is not necessary and there is easy access to public transit, walking and biking [5]. Several studies show that these changes are likely long term and are reflective of future transportation trends [6].
In Milwaukee, specifically, driving has fallen to such an extent that as an urbanized area, it was found to rank second in the nation in terms of a decline in miles driven [7]. Wisconsin is also an increasingly aging state, with almost all of the population increase over the next fifty years going to be composed of those over 60 [8]. They will require an increased level of accessible transportation when they are unable to drive.
With a discrepancy of 11,300 cars in WisDOT’s own data – it is baffling that a decision to expand the highway at up to a cost of $1.2 billion could be made.
 The DEIS, however appears to cherry pick data that portray traffic as increasing on a large scale.
For example, this comment on the DEIS (pg 1-24) “Between 1989 and 2009, traffic volumes on I‐94 east of the Stadium Interchange increased approximately 5 percent, and traffic volumes west of the Stadium Interchange increased approximately 17 percent”.
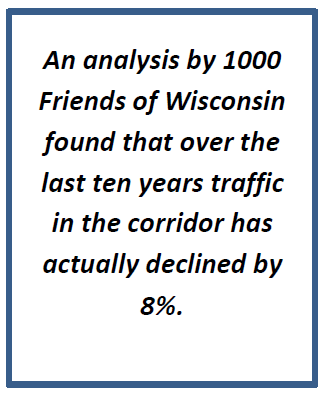
However, an analysis by 1000 Friends of Wisconsin found that over the last ten years traffic in the corridor has actually declined by 8%.
The DEIS also does not take into account, or mention the demographic changes that predict a decline, or no increase in driving into the future [8]. If current trends continue – a simple extrapolation shows that traffic on the corridor would be approximately 20,000 vehicles per day (vpd) lower than current levels.
While this may seem unrealistic, this is the same methodology that is being used to predict increased future traffic on the corridor.
Cited Works:
[1] C. McCahill. [Online]. Available: https://www.ssti.us/2014/02/vmt-drops-ninth-year-dots-taking-notice/.
[2] S. Sivak, “Update: Percentage of Young Persons with a Driver’s License Continues to Drop,” Traffic Injury Prevention, p. 13(4):341, 2012.
[3] APTA, “Transit News,” [Online].
[4] B. McKenzie, “Modes Less Traveled—Bicycling and Walking to Work in the United States: 2008–2012,” United States Census Bureau, 2014.
[5] D. A. P. P. J. M. T. R. F. Steven G. Wilson, “Patterns of Metropolitan and Micropolitan Population Change:2000 to 2010,” U.S. CENSUS BUREAU, 2012.
[6] C. A.-P. a. N. G. Timothy Garceau, “Peak Travel and the Decoupling of Vehicle Travel from the Economy: A Synthesis of the Literature,” Transportation Research Board, 2015.
[7] P. Baxandall, “Transportation in Transition: A Look at Changing Travel Patterns in America’s Biggest Cities,” 2013.
[8] C. M. a. C. Spahr, “VMT Inflection Point: Factors Affecting 21st Century Travel,” 2014.